How To Best Sell Your House
02nd February 2022In 2021, nearly one third of homes across England and Wales sold for more than their asking price, showing the strength of the sellers’ market during coronavirus, as well as the impact of housing shortages, low mortgage rates and the incentive of the stamp duty holiday. Along with the demand for homes better suited to home-working – 2020 saw 46.6% of people in employment working at home during April, and June 2021 saw 44% of those working at home – there has never been such a demand for more appropriate housing, and there are plenty of buyers looking. And though this all sounds positive for those looking to re-enter the property chain, there is a method to selling your home, when’s best to do so, and how you should go about doing this. Here at JonSimon Estate Agents, we’ve taken an in depth look at historical data from the Land Registry for the areas in which we serve – Burnley, Ramsbottom and Radcliffe – to determine house sales, average house prices and when, based on this, would be most appropriate to put your home on the market.
We shall go through this data within this extensive guide, and then provide you with recommendations for how best to sell your home, in which our estate agents can support. Having put houses for sale on the market since 2008, we’re an estate agency you can trust, and we’ll always put your best interests at the core of our processes. We truly hope you find this guide helpful, and for further information, please do not hesitate to contact our offices via the following telephone numbers:
How To Sell Your House – The Data From Our House Sales Study
Our study looks at the UK housing market between 1995 – 2022, to gain a good understanding of house sales spread across months, years and their average prices. With this data, we can provide insight into why certain months may prove more lucrative than others when it comes to house sales, and how you can prepare. Let’s firstly take a look at Burnley’s data.
Burnley
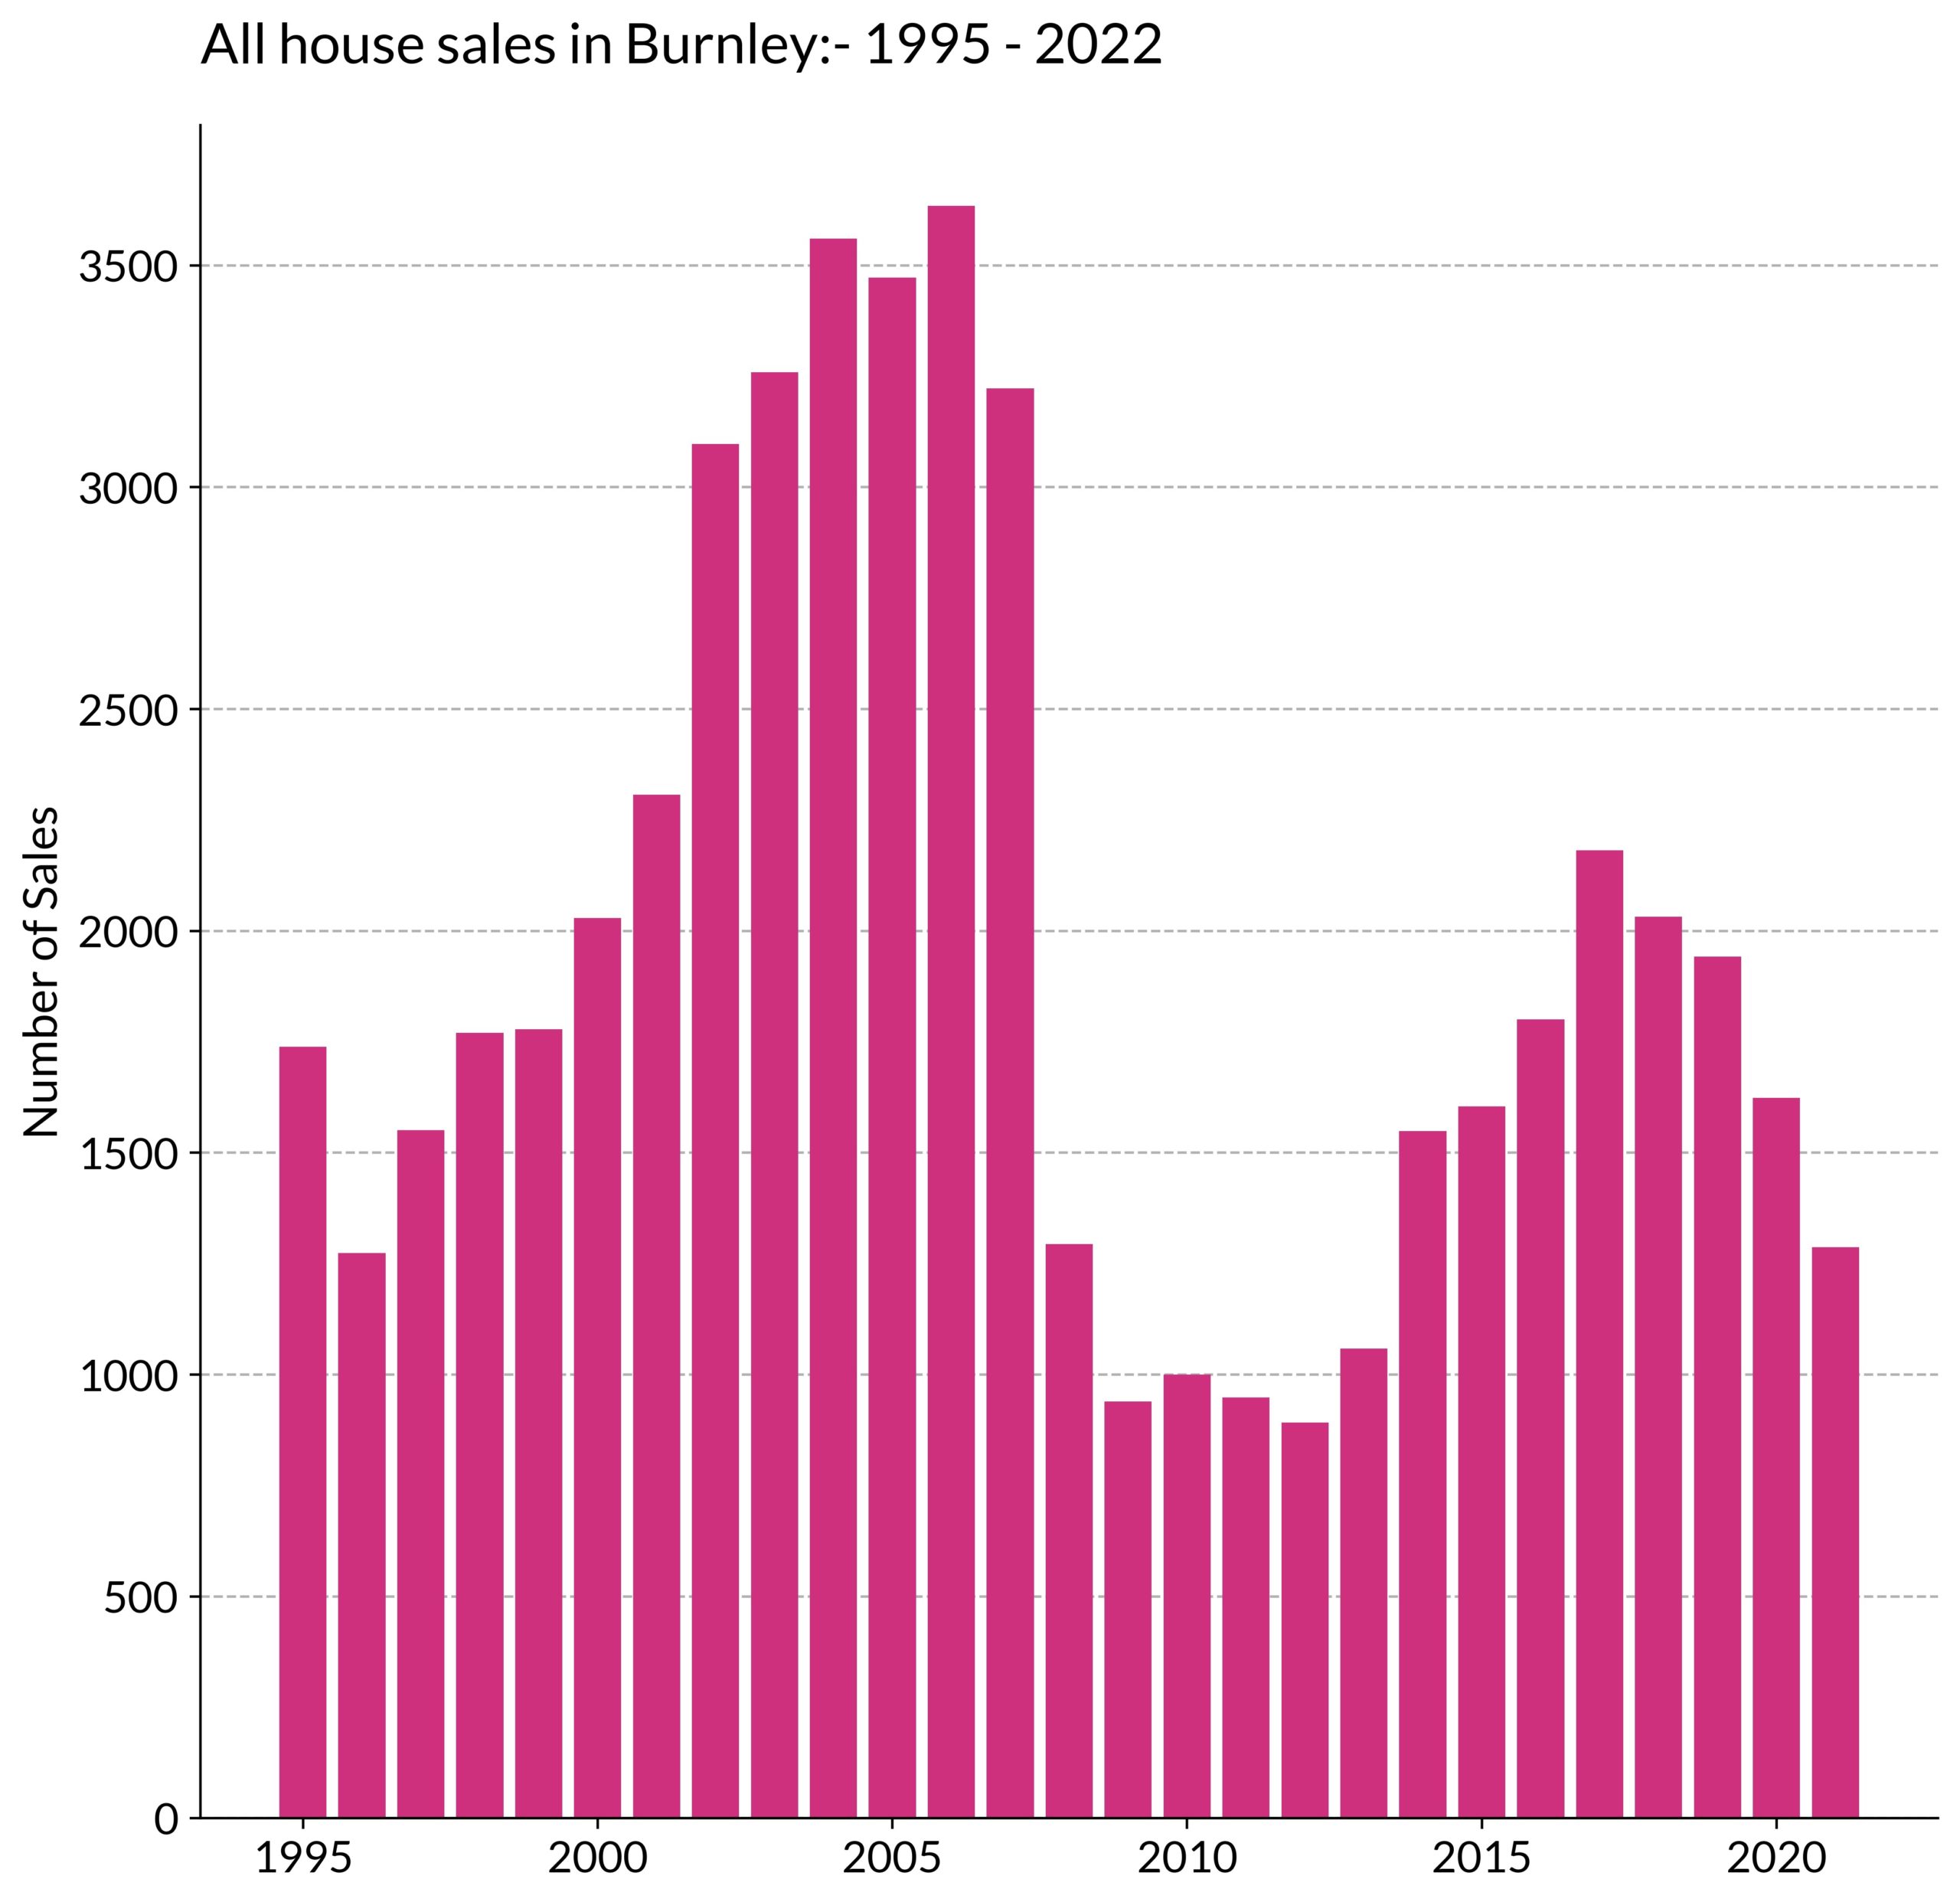
Between 1995-2022, the best year for house sales was 2006, with 3634 homes sold, closely followed by 2004 with 3560 houses successfully sold. From 1998 until the housing crash in 2008, there was a steady increase in house sales, with some years levelling out with stability. For example, there were 1770 homes sold in 1998, 1778 in 1999 and 2029 in 2000, along with 2307, 3097, 3259 and 3560 sold in the following four years. The 2008 housing market crash impacted Burnley hard, and as can be seen from the graph below, hasn’t reached the same levels since. The greatest number of houses sold since 2008 was 2021 in 2017, though most figures are in the early one thousands.
When it comes to average house prices, although the price remained relatively stable between 1995 – 2002, with homes going from between £36,269 and £43,576, there was a steady increase from 2002 onwards, with houses going for as much as £96,378 in 2007. Minor declines from 2008 were to be expected, but 2016 sparked an uprise year on year, with the average price per home sold reaching £114,732 in 2021. According to the Burnley Express, this made the area sixth among the North West’s 43 local authorities for annual growth. The best annual growth within the area was Rossendale – where property prices rose on average by 24.6%, to £182,000.
When it comes to the time of the year when house sales were most successful – according to our data – between 1995-2022, June and July were pretty successful months, with 4821 sales and 4513 sales respectively. October and November were also pretty good months for house sellers to extract contracts, with 4771 sales and 4684 sales going through. With the average time to sell a house taking between 3-6 months, it’s likely these house sellers were putting their prior homes on the market early in the year with a view to moving out just before summer hit, or the festive season took hold. Therefore, if you’re thinking of selling a house in Burnley, based on the data, you may be wise to do the same, as house buyers may have similar thought processes in regards to when they’d like to move in.
Radcliffe
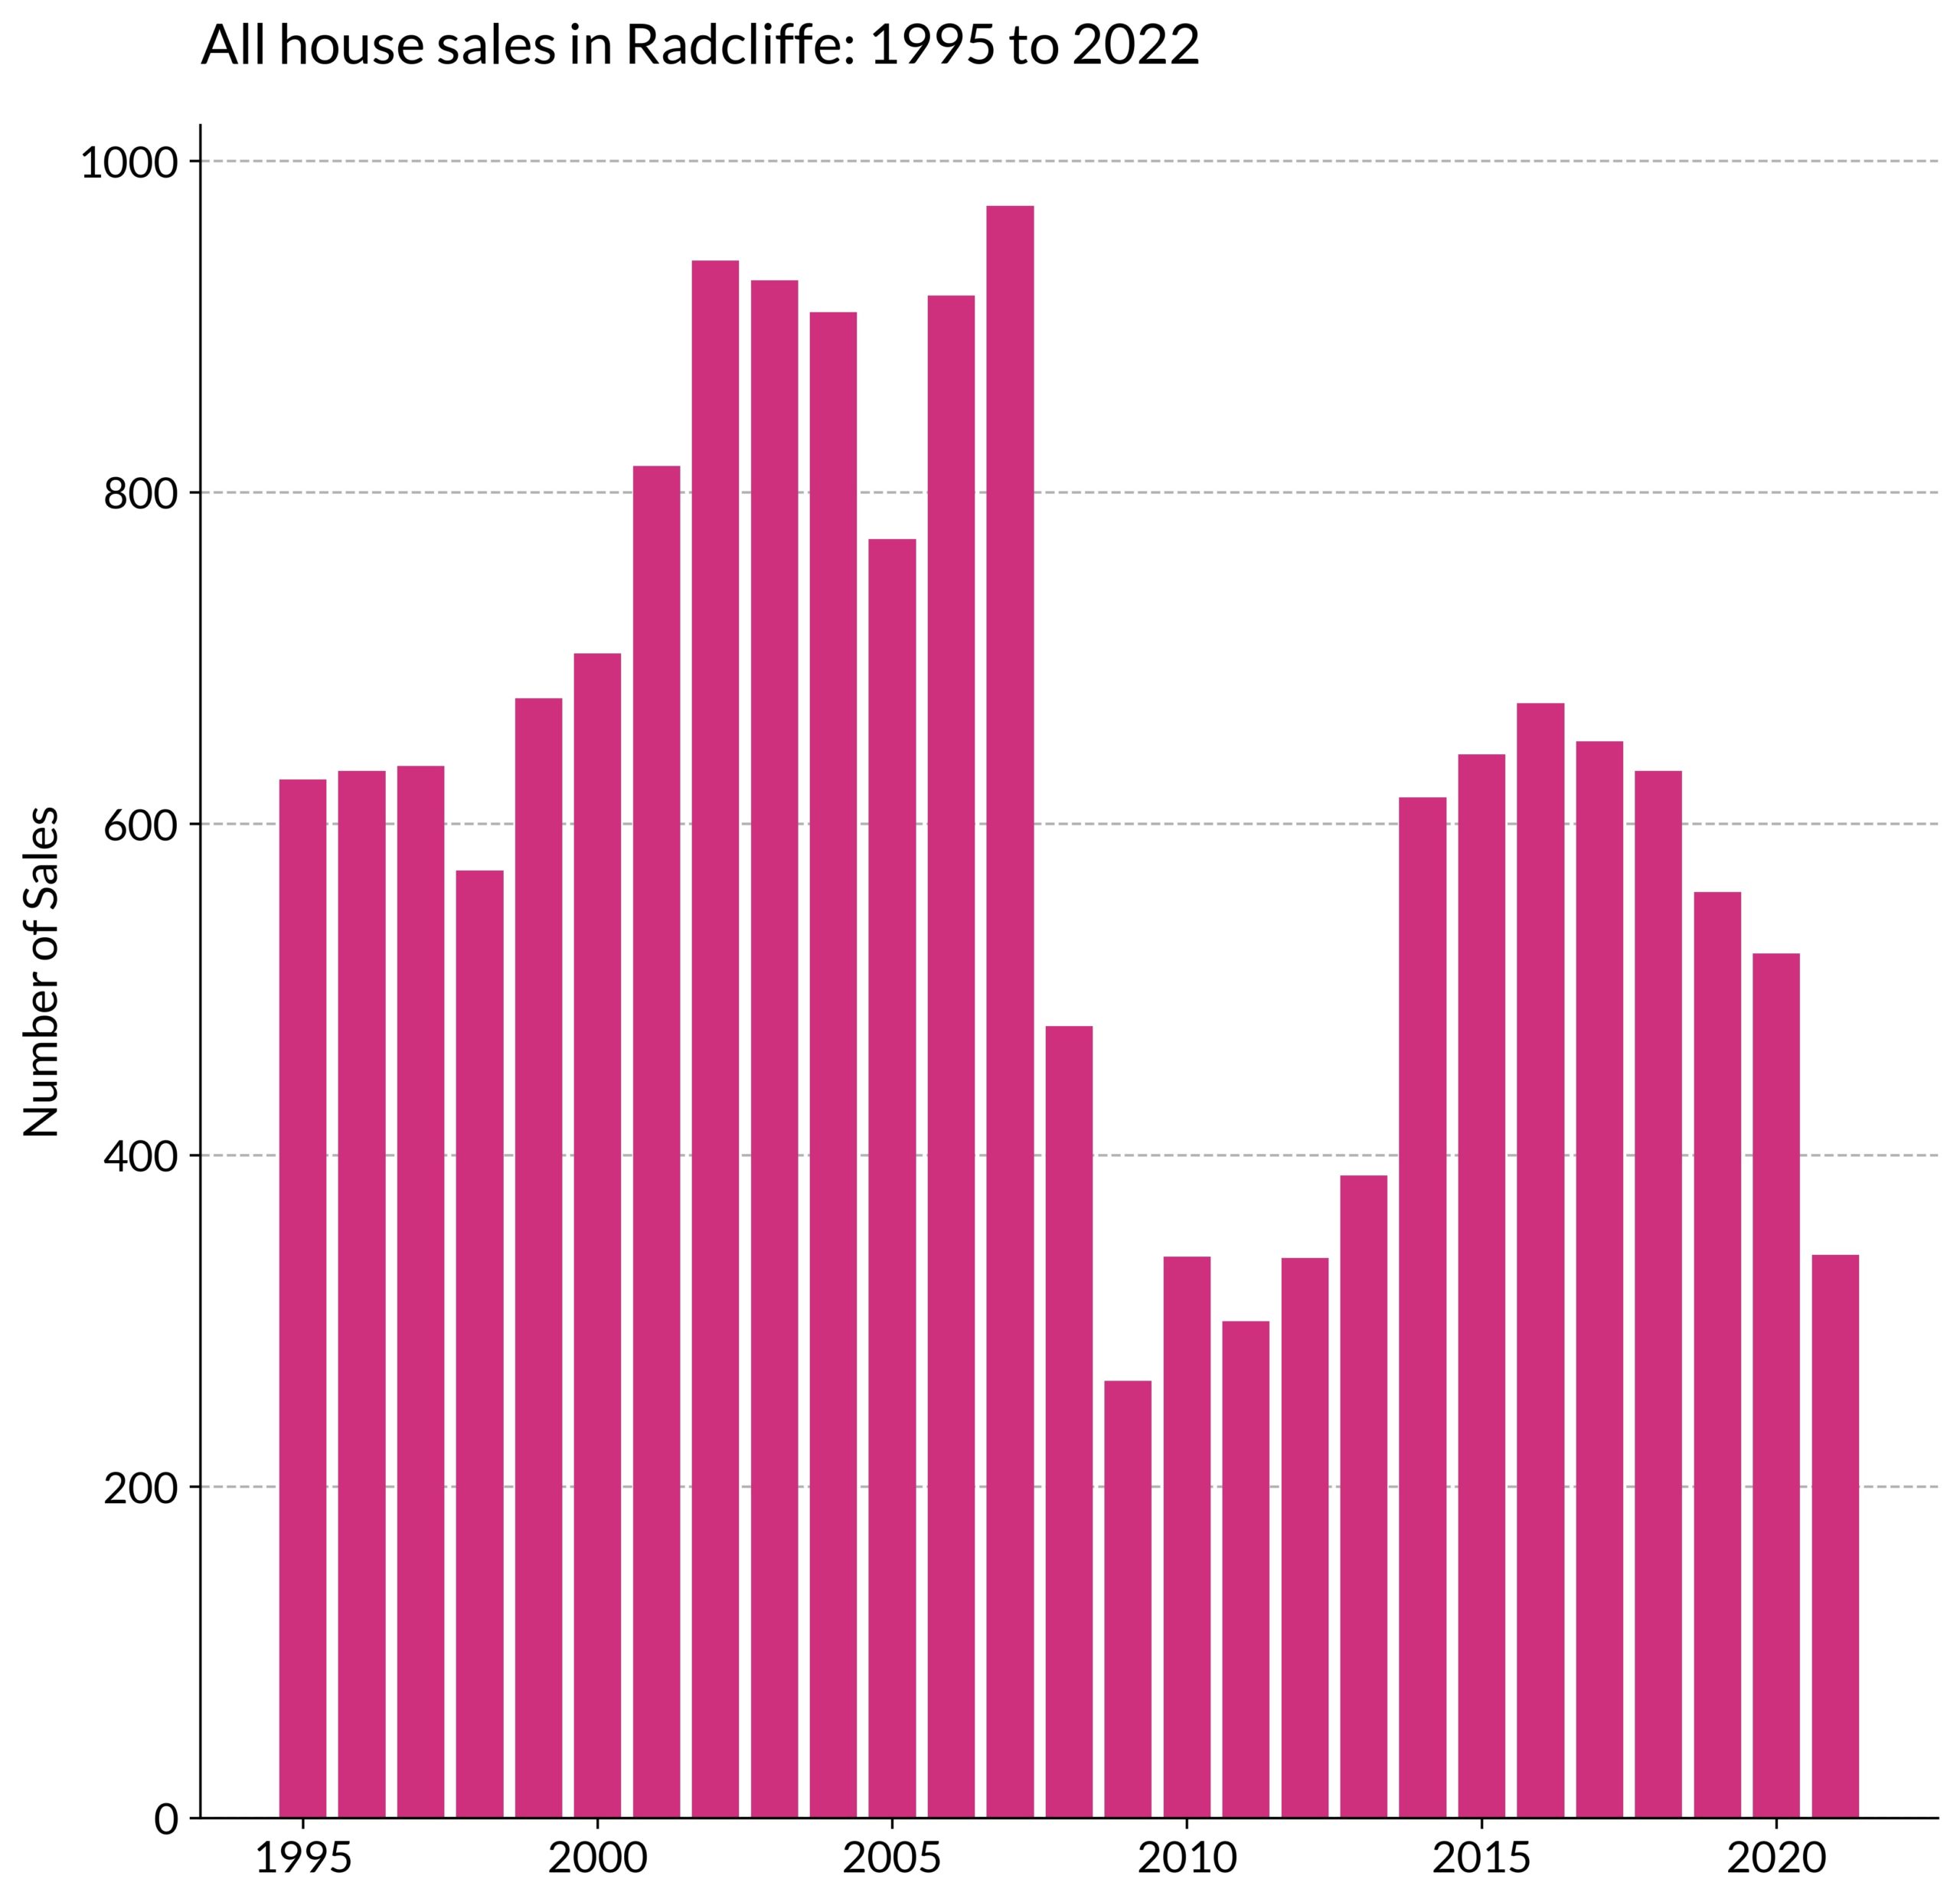
Between 1995-2022, the best year for house sales was 2007, with 973 sold, closely followed by 2002 and 2003, with 940 and 928 homes sold respectively. Radcliffe’s housing market has never quite recovered since the housing crash in 2008, with a big dip to 478 houses sold in 2008, and this nearly halving in 2009 to 264. Fortunately, there was some uplift from 2013 onwards, with 388 homes sold in said year, and then figures reaching the 600’s and 500’s in the succeeding years. Coronavirus likely impacted the slight decline in house sales in 2021, although the data suggests peaks and troughs, and that within the next few years, that will rise again.
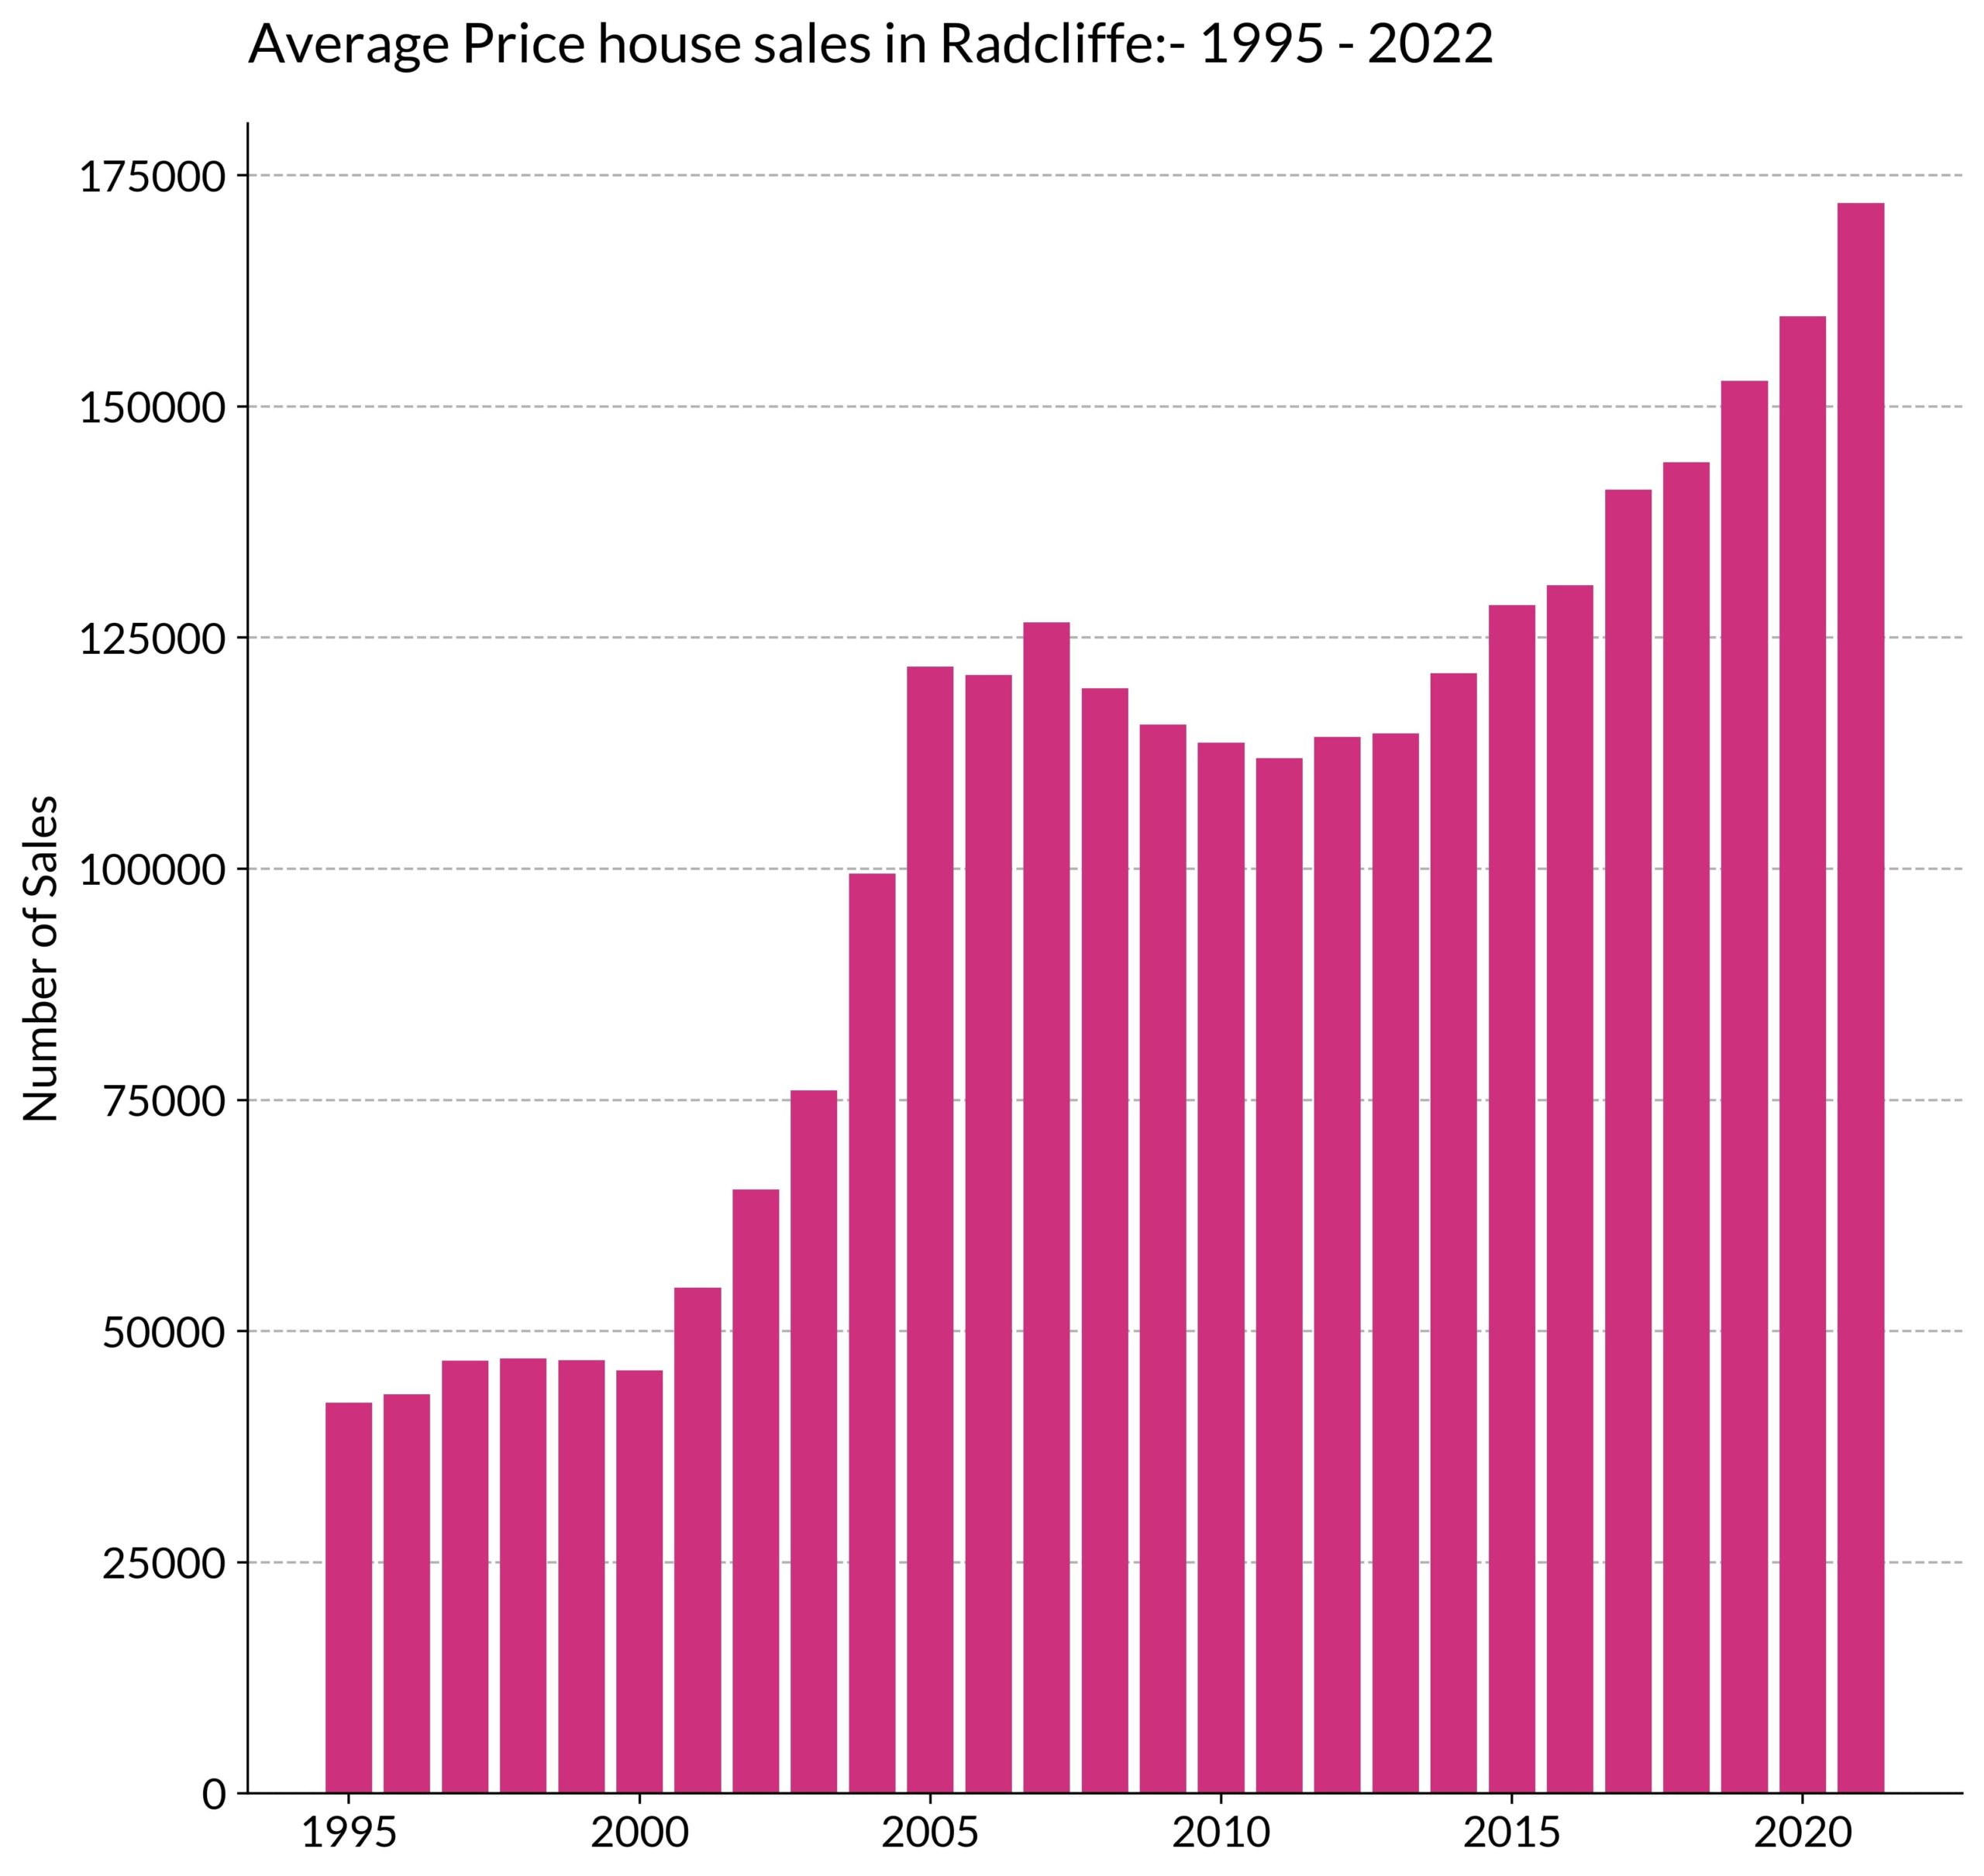
Average house price sales have increased 306.99% since 1995, which is interesting, and likely to do with the regeneration of the area. Pretty much year on year, there has been a rise in average house prices, starting with £42,259 in 1995 through to £171,988 in 2021. The biggest rise was between 2003 – 2004, where they rose from £76,047 to £99,491. Although there were some minor declines in 2008, the market held relatively steady from 2009-2013, with good increases from 2014-2021.
As can be seen from the graph below, the following were the average sales prices between said years:
- 2014 – £121,125
- 2015 – £128,522
- 2016 – £130,653
- 2017 – £141,004
- 2018 – £143,974
- 2019 – £152,762
- 2020 – £159,736
- 2021 – £171,988
In terms of the month of the year when selling your house in Radcliffe could prove best, according to our data, this month is June, with 1581 house sales on average, with March not far behind, with 1550. July and September have also proven to be successful months, with 1543 and 1492 house sales. This suggests that Radcliffe residents consider putting their house on the market toward the end of the year, and at the start of the next one, with a view to selling a house by the time summer rolls around.
Ramsbottom
Houses for sale in Ramsbottom have seen some interesting data, with the average sale price having increased by 372.47% since 1995. Between 1995-2022, the greatest number of house sales occurred in 2002, with 529 sold, with 2006 and 2004 not far behind, with 463 and 457 respectively. Unfortunately, the 2008 house market crash took its toll in Ramsbottom, with the succeeding three years seeing a great decline. 2010 saw only 157 homes sold, for example. There has been an increase in homes sold since that time however, with figures remaining relatively steady, and therefore if you’re looking to sell your house in Ramsbottom, you shouldn’t worry too much – especially with a trusted estate agents such as JonSimon by your side.
What’s more, the average house price has risen greatly since 1995, when this was £55,311.75. In 2021, this figure was £261,331.82. With only slight dips in 2009, 2011 and 2016, the Ramsbottom housing market has continued to go from strength to strength when it comes to the amount sellers could make. Some highlights include:
- Between 2000 and 2010, the average sale price rose from £78,729.71 to £160,724.53.
- Although 2011 saw a dip, the following year saw an approximately £14,000 increase in average sale price.
- Between 2012 and 2021, the average sale price has risen by over £100,000.
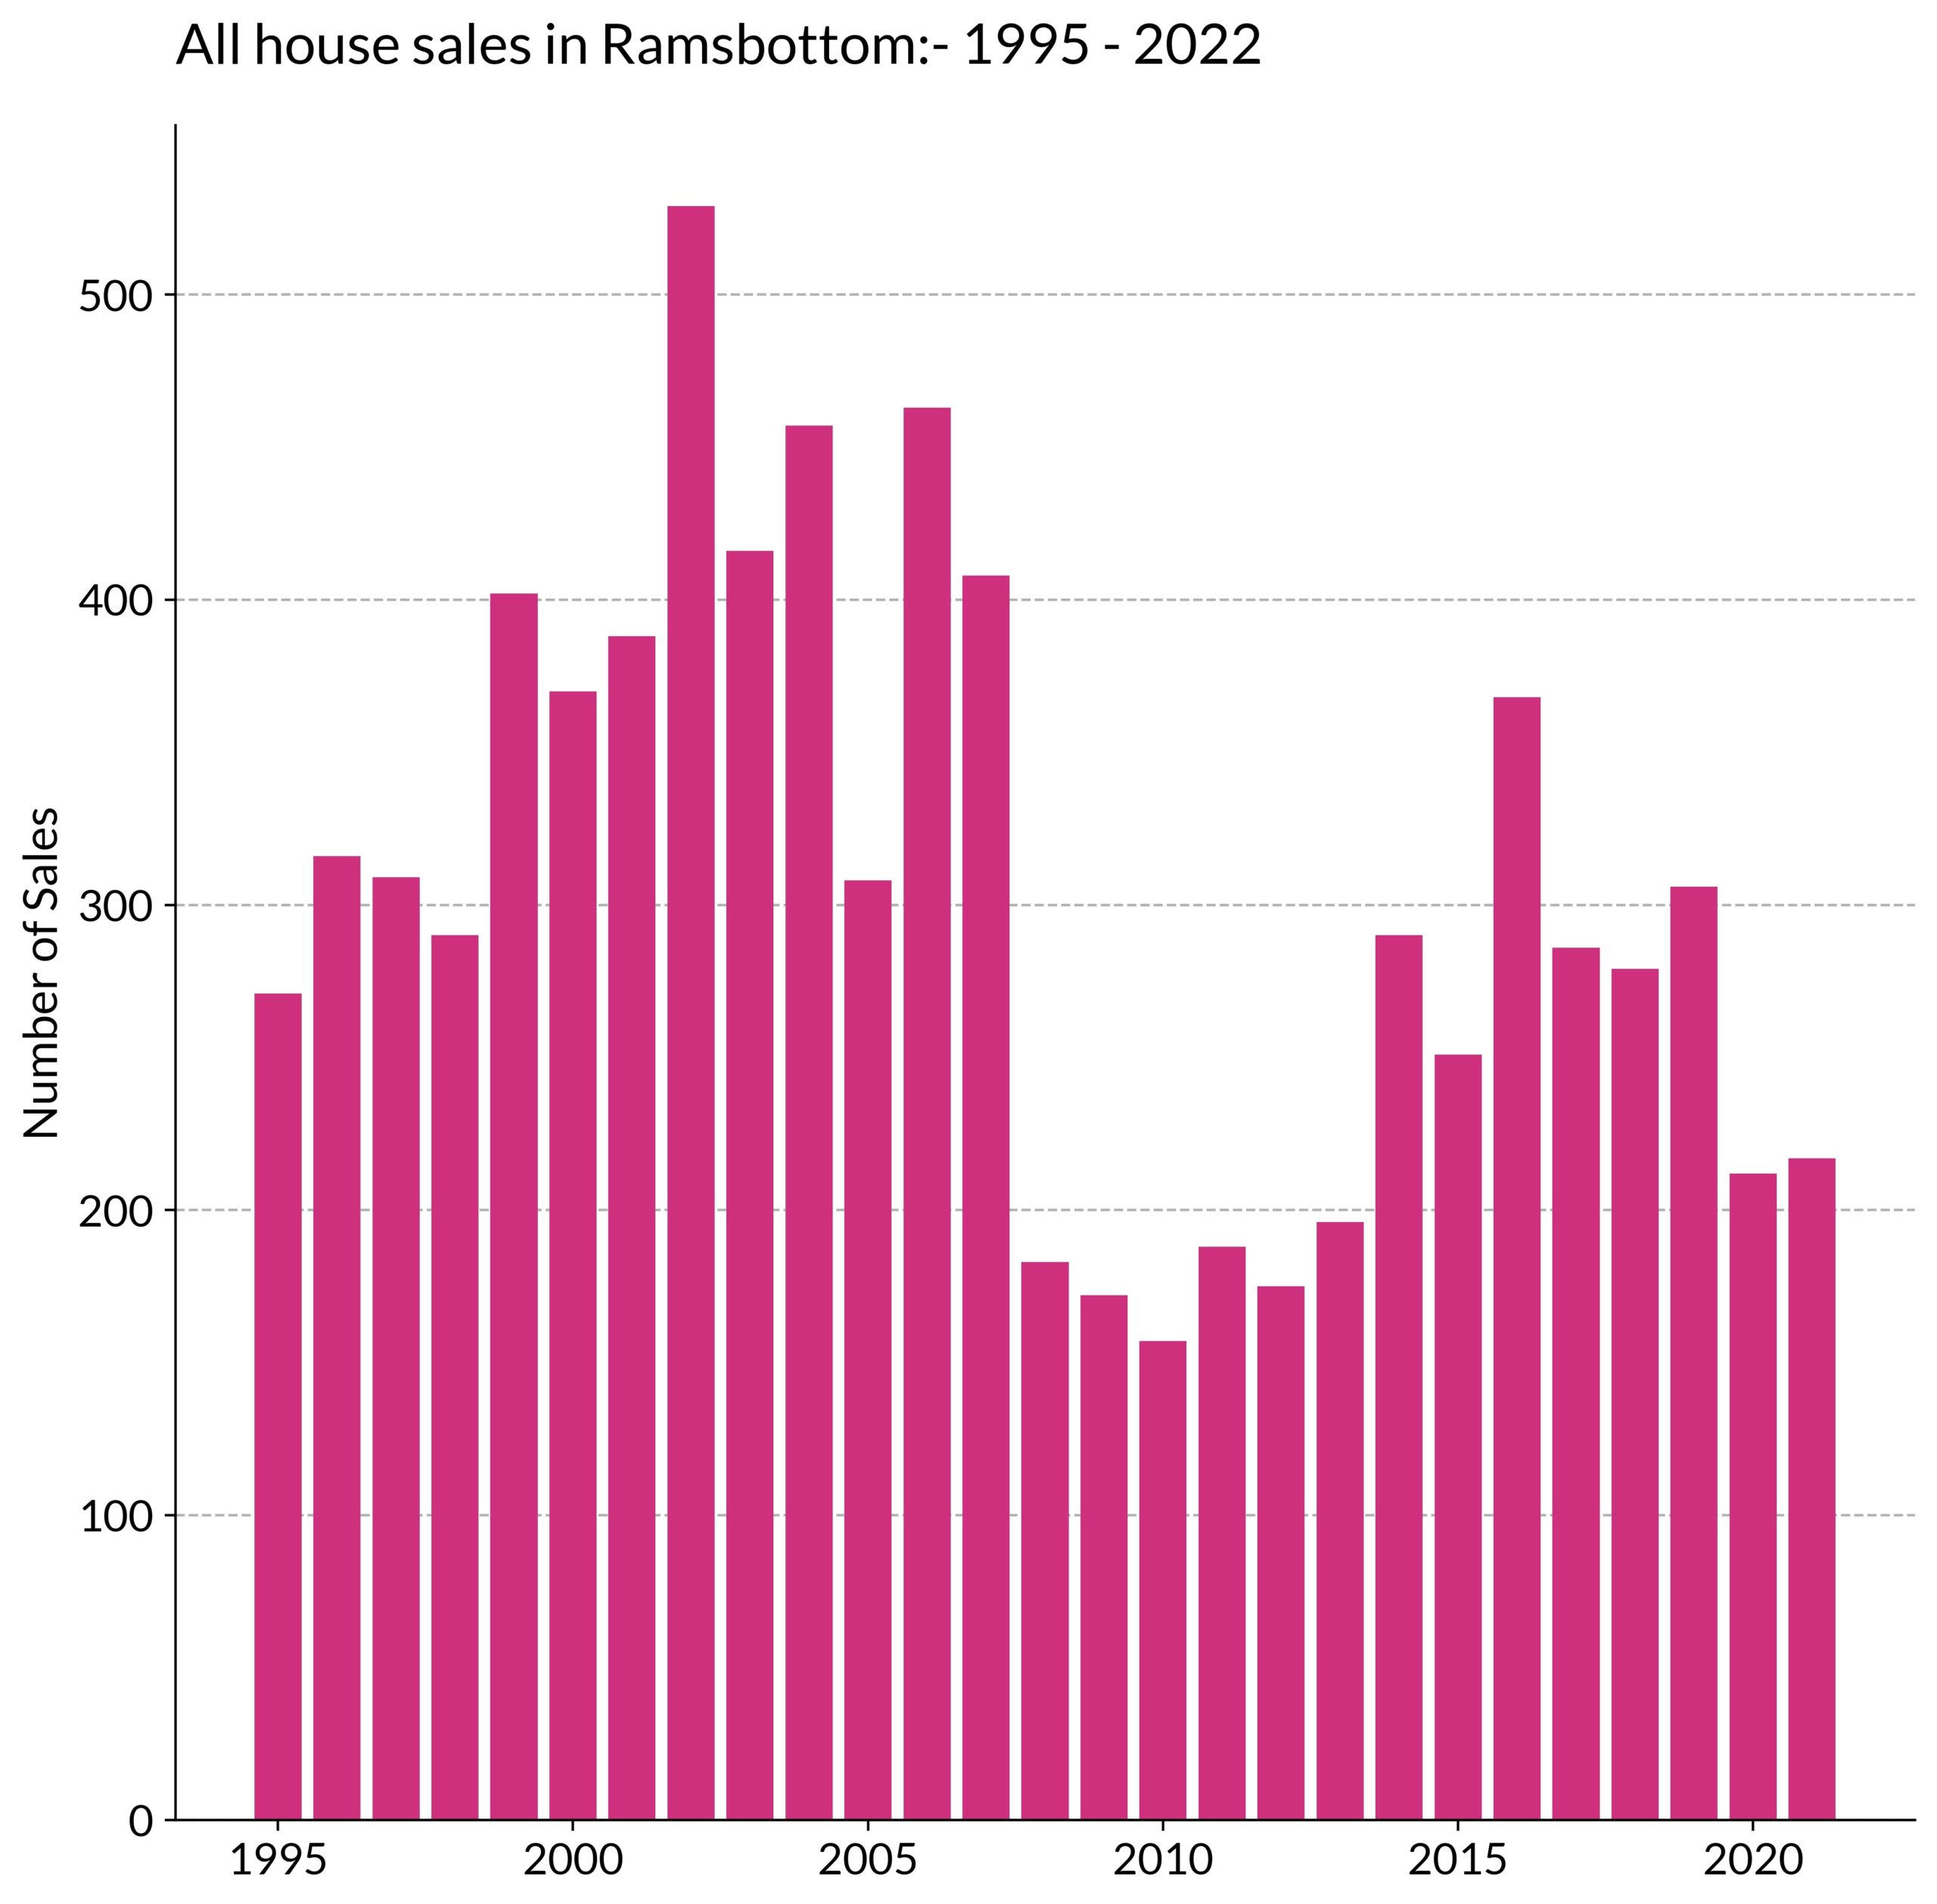
According to our data, the best time of the year to sell your house is October, with 795 houses sold on average. August also proves to be a good month, with 792 house sales. The lowest number of sales occur in January and February, with 519 and 526 house sales respectively. This would suggest that home buyers much prefer the warmer months to move into their new home, and house sellers in Ramsbottom would be wise to accommodate this.
From Valuations To Decorations – How To Sell Your Property
Knowing when’s the best time to sell your house in Burnley, Radcliffe and Ramsbottom is one thing, selling it is another. What follows is best practice for selling your home, so that it becomes a buyer’s much sooner.
1.) Boost Kerb Appeal
With this being the first thing potential buyers will look at when viewing a property, it’s key the outside of your home looks fantastic. A YouGov study of over 2,000 UK adults revealed that clean windows and a well-maintained roof were the most important features of kerb appeal, followed by a well-kept garden, driveway and fences (where applicable). Other key features included: an attractive front door, clear and functioning gutters and being well-lit. Before having photographs taken of your property for online viewings, as well as before having potential buyers pop around, we’d recommend taking this all into consideration, and ensure your house appears a viable prospect.
2.) Kitchen Renovations & Updates
With the kitchen being the most valuable room in the house, as well as what can make the difference for unsure buyers, it’s imperative that your kitchen is a stand out room. To ensure this is the case, we suggest refacing your kitchen cabinetry to give it that new kitchen look without the costs of upgrading it completely. On the other side, upgrading countertops can be expensive, but can add some serious value to the home. Consider how much better surfaces look in comparison to mouldy, worn out and peeling cabinets. What’s more, decluttering any kitchen surfaces can allow potential buyers the opportunity to see a clean, open space and imagine their own appliances there. Leaving a fruit bowl can help from an aesthetic and aromatic viewpoint too.
3.) Clean, Fix & Mend
All houses experience wear and tear, and much of the time, the repairs required are minimal. Therefore, where possible, we advise you to fill in holes in the wall, fix broken door knobs and cracked tiles, and attend to torn or thready carpets. Most buyers will want to move without making these simple repairs, so doing this for them will certainly help. What’s more, clean all surfaces and appliances until they shine, and remove any limescale, grout and any unseemly odour that could deter potential buyers. Hanging up fresh towels in the bathroom and kitchen, and placing flowers in key spaces can help too, making the house seem far more appealing. And when it comes to the garden, trim the bushes, clean the patio, and ensure any garden furniture isn’t dirty. Cut the grass, and plant some flowers too.
4.) Get a proper valuation
Property valuations are key to ensuring that your house is listed fairly, that key house features are accounted for and that you are getting a good price for your prior home. Here at JonSimon Estate Agents, we determine valuations based on a specialist algorithm and smart technology that collates information on recently sold property prices from over 20 million Land Registry records to give trustworthy results. Along with this, we’ll also take the property’s condition into account and make recommendations for renovations and/or updates that could increase its value. It should be noted that for houses last sold prior to January 1995 – the valuation will be estimated based on neighbouring sales.
Other key considerations include checking your mortgage term, thinking how best to advertise your property (i.e. through portals such as Zoopla and Rightmove) and regularly keeping on top of solicitors and ensuring the property chain is moving in the right direction. Conveyancing and house surveys are also fundamental, as is arranging any removals and change of address correspondences.
If you’re looking to sell your property, then we here at JonSimon Estate Agents can help. Right from the start, we’ll ensure we take you through the process in a clear and concise manner, and that we answer any and all questions along the way. We encourage you to contact us today to learn more about our services and how we can best help you.